The 7 common SPC chart rules help detect abnormal variation in a process.
They include patterns like points outside control limits, trends, and cycles.
These rules help identify when a process is out of control and needs correction.
In this article:
- 7 Rules in an SPC Control Chart (Western Electric Rules)
- Basic SPC Control Chart Structure
- Rule 1: One Point Outside Control Limits
- Rule 2: Two Out of Three Points in Zone A
- Rule 3: Four Out of Five Points in Zone B or Beyond
- Rule 4: Eight Consecutive Points on One Side of Center Line
- Rule 5: Six Consecutive Increasing or Decreasing Points (Trend Rule)
- Rule 6: Sudden Shift or Cycle Pattern
- Rule 7: Excessive Near-Control-Limit Points (Zone Rule)
- SPC Zone Concept
- Summary of 7 SPC Rules
- Why These Rules Matter
- Example in Industry
- Real-Life Analogy
- Conclusion
7 Rules in an SPC Control Chart (Western Electric Rules)
In Statistical Process Control (SPC), control charts are used to detect whether a process is stable or showing abnormal variation.
The “7 rules” (often called Western Electric rules or Nelson rules) help identify when a process is out of statistical control, even if points are still inside the control limits.
Basic SPC Control Chart Structure
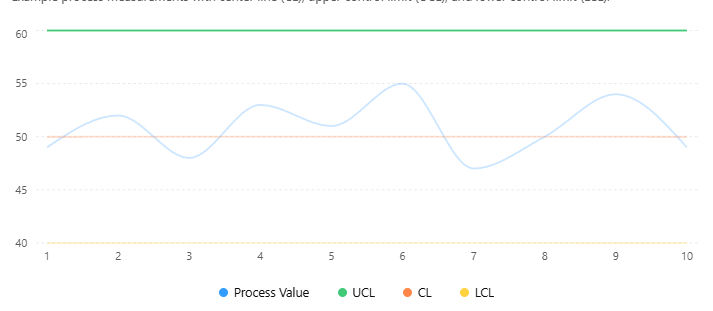
A control chart has:
- Center Line (CL) → process average
- Upper Control Limit (UCL) → upper boundary
- Lower Control Limit (LCL) → lower boundary
If data points behave abnormally within these limits, the process may still be unstable.
Rule 1: One Point Outside Control Limits
Rule
Any single point outside UCL or LCL indicates a process is out of control.
Definition
This is the strongest signal of a problem.
Cause
- Machine failure
- Wrong setting
- Material defect
- Measurement error
Rule 2: Two Out of Three Points in Zone A
Rule
Two out of three consecutive points fall in Zone A or beyond (near UCL or LCL).
Definition
Process is shifting toward instability.
Example
Points close to upper limit repeatedly may indicate:
- Tool wear
- Increasing temperature
- Drift in machine calibration
Rule 3: Four Out of Five Points in Zone B or Beyond
Rule
Four out of five consecutive points lie in Zone B or Zone A (above or below center line).
Definition
A sustained trend away from the center line is occurring.
Cause
- Gradual machine wear
- Process drift
- Raw material change
Rule 4: Eight Consecutive Points on One Side of Center Line
Rule
Eight or more consecutive points are all above or all below the center line.
Definition
Process average has shifted.
Example
If all points are above average:
- Mean value has increased
Cause
- Machine recalibration shift
- New batch of material
- Operator change
Rule 5: Six Consecutive Increasing or Decreasing Points (Trend Rule)
Rule
Six or more points continuously increase or decrease.
Definition
A clear trend is present.
Cause
- Tool wear
- Temperature drift
- Gradual process deterioration
Rule 6: Sudden Shift or Cycle Pattern
Rule
Repeating cycles or sudden shifts in pattern indicate instability.
Definition
Process is influenced by an external periodic factor.
Cause
- Shift changes (day/night operator differences)
- Machine vibration cycles
- Environmental temperature cycles
Rule 7: Excessive Near-Control-Limit Points (Zone Rule)
Rule
Too many points fall in Zone A or near control limits.
Definition
Process variation is increasing even if still within limits.
Cause
- Increasing variability
- Poor material consistency
- Machine instability
SPC Zone Concept
Control charts are divided into zones:
- Zone C → near center line
- Zone B → intermediate region
- Zone A → near control limits
Visual idea:
UCL
 |   Zone A
 |   Zone B
 |   Zone C (center)
 |   Zone B
 |   Zone A
LCL
Summary of 7 SPC Rules
| Rule | Signal | Meaning |
|---|---|---|
| 1 | One point outside limits | Strong out-of-control signal |
| 2 | 2 of 3 in Zone A | Shift toward instability |
| 3 | 4 of 5 in Zone B/A | Process drift |
| 4 | 8 points on one side | Mean shift |
| 5 | 6 increasing/decreasing | Trend present |
| 6 | Cycles or sudden shifts | External variation |
| 7 | Too many near limits | Increasing variability |
Why These Rules Matter
Even if a process is inside control limits:
- It may still be unstable
- It may be slowly drifting toward failure
These rules help detect problems early.
Example in Industry
Bolt Diameter Production
Target: 10 mm
Without SPC rules
- Only check if values are within limits
- Miss slow drift
With SPC rules
- Detect trend early (Rule 5)
- Adjust machine before defects occur
Result:
✔ Reduced scrap
✔ Stable production
✔ Better quality control
Real-Life Analogy
Think of driving a car:
- Rule 1 → hitting the road boundary (very serious)
- Rule 5 → car slowly drifting to one side
- Rule 4 → steering consistently off-center
SPC rules help you correct problems before an accident happens.
Conclusion
The 7 SPC control chart rules are a set of statistical guidelines used to detect abnormal variation in a process. They identify early warning signs such as trends, shifts, cycles, and unusual clustering of data points. These rules are essential in modern quality control because they help engineers detect process instability early, prevent defects, and maintain consistent product quality before problems become serious.
Other courses: