
Psychrometric Chart – Understanding Air Properties Graphically
A psychrometric chart is a graphical representation of the thermodynamic properties of moist air. It helps engineers analyze and design HVAC systems, air conditioning, industrial drying, and climate control.
In this article:
- How to Read a Psychrometric Chart
- 1️⃣ Dry Bulb Temperature (DBT) – X-Axis (Horizontal) 🌡️
- 2️⃣ Humidity Ratio (Specific Humidity) – Y-Axis (Vertical) 💦
- 3️⃣ Saturation Curve (100% RH) – The Curved Line 🌫️
- 4️⃣ Relative Humidity (RH) – Curved Lines Inside Chart 📈
- 5️⃣ Wet Bulb Temperature (WBT) – Diagonal Lines 💨
- 6️⃣ Enthalpy (Total Heat) – Slanted Lines 🔥
- 7️⃣ Dew Point Temperature – Along the Saturation Curve ❄️
- How to calculate values from Psychrometric charts:
- Psychrometric Processes on the Chart
- Why is the Psychrometric Chart Important?
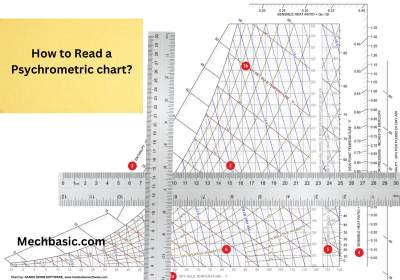
How to Read a Psychrometric Chart
A typical psychrometric chart consists of various curves and lines representing different air properties. Here’s how to interpret it:
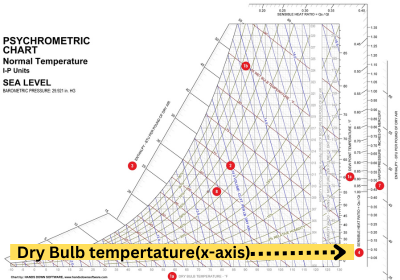
1️⃣ Dry Bulb Temperature (DBT) – X-Axis (Horizontal) 🌡️
- Found at the bottom of the chart.
- Measures the actual air temperature in °C or °F.
- Moves left to right as the temperature increases.
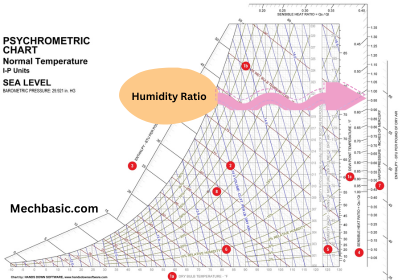
2️⃣ Humidity Ratio (Specific Humidity) – Y-Axis (Vertical) 💦
- Found on the right side of the chart.
- Represents the amount of moisture in air (kg of water per kg of dry air).
- Moves upward as moisture increases.
The humidity ratio is sometimes referred to as the “mixing ratio” or “absolute humidity.”
3️⃣ Saturation Curve (100% RH) – The Curved Line 🌫️
- The leftmost curve represents fully saturated air (RH = 100%).
- Any point on this line is dew point temperature, where condensation begins.
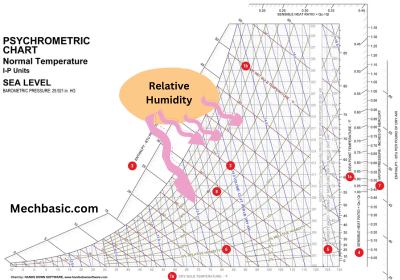
4️⃣ Relative Humidity (RH) – Curved Lines Inside Chart 📈
- Curved lines within the chart represent different RH values (10%, 20%, 50%, etc.).
- As air moves closer to the saturation curve, RH increases.
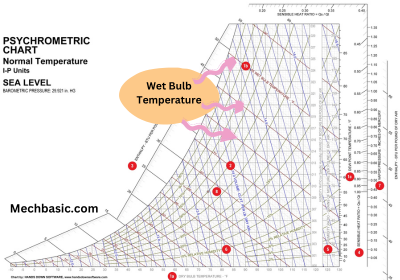
5️⃣ Wet Bulb Temperature (WBT) – Diagonal Lines 💨
- Shows how much cooling can occur due to evaporation.
- Important for evaporative cooling and cooling towers.
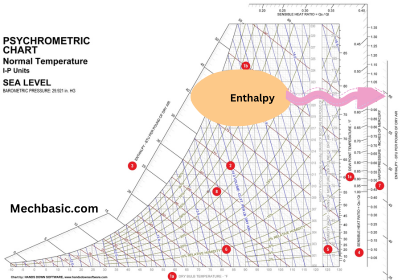
6️⃣ Enthalpy (Total Heat) – Slanted Lines 🔥
- Represents the total energy content of air (sensible + latent heat).
- Used in HVAC energy calculations.
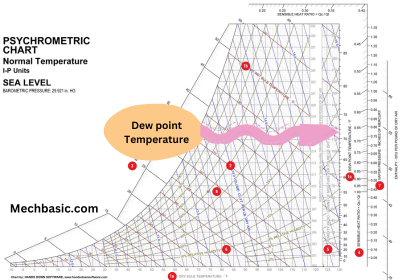
7️⃣ Dew Point Temperature – Along the Saturation Curve ❄️
- The temperature where moisture starts condensing.
- Any cooling below this temperature causes dew/fog/condensation.
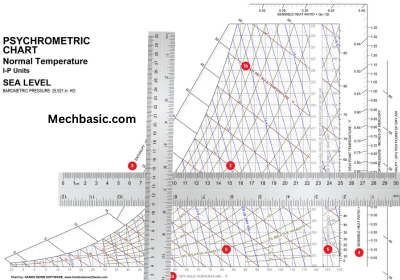
How to calculate values from Psychrometric charts:
Step 1: Identify known parameters given in the chart and mark them out.
For example :
Dew point Temperature= 50’F.
Dry bulb Temperature = 50’F.
Step 2 : Use a scale or ruler
Use a scale or ruler and note down the point of intersection to note down the unknown values.
Psychrometric Processes on the Chart
1️⃣ Sensible Heating (Moving Right) 🔥
- Air temperature increases, but humidity stays the same.
- Example: Room heater.
2️⃣ Sensible Cooling (Moving Left) ❄️
- Air temperature decreases, but humidity stays the same.
- Example: Air conditioning.
3️⃣ Cooling & Dehumidification (Down & Left) ❄️💧
- Air temperature drops, and moisture condenses.
- Example: AC cooling coils.
4️⃣ Humidification (Moving Up) 💦
- Moisture is added, increasing humidity.
- Example: Steam humidifiers in HVAC.
5️⃣ Evaporative Cooling (Moving Downward Along WBT) 💨
- Air cools while maintaining enthalpy.
- Example: Cooling towers or desert coolers.
Why is the Psychrometric Chart Important?
✅ Helps engineers design HVAC systems efficiently.
✅ Determines cooling load, heating needs, and moisture control.
✅ Used in weather forecasting, drying processes, and comfort analysis.
Also Read:
Air Properties in Psychrometrics( Dry bulb, wet bulb temperatures etc….)