Tempering temperature is selected based on the required hardness and material properties.
Lower temperatures maintain higher hardness, while higher temperatures increase toughness.
Typical tempering temperatures range from 150°C to 650°C depending on the steel type.
In this article:
How to calculate tempering temperature?
Tempering temperature is the temperature to which a quenched metal (usually steel) is reheated during the tempering process to achieve desired mechanical properties such as hardness, toughness, ductility, and strength.
Unlike a direct mathematical formula with one fixed answer, tempering temperature is selected or estimated based on material properties and required hardness. Engineers usually determine it using:
- Steel composition
- Desired hardness
- Mechanical property requirements
- Tempering charts/tables
- Empirical relationships
Basic principle
During tempering:
- Steel is quenched → becomes very hard but brittle
- Steel is reheated below critical temperature
- Internal stresses reduce
- Toughness increases
The selected temperature controls the final properties.
General rule:
Higher tempering temperature → lower hardness but higher toughness
Lower tempering temperature → higher hardness but lower toughness
Common tempering temperature range
Typical range:
150°C–650°C
Different ranges produce different effects:
| Tempering temperature | Result |
|---|---|
| 150–250°C | High hardness retained |
| 250–450°C | Moderate hardness and toughness |
| 450–650°C | High toughness and ductility |
Methods used to determine tempering temperature
1. Based on required hardness
One common method is selecting temperature according to desired Rockwell hardness.
Example:
| Tempering temperature | Approximate hardness effect |
|---|---|
| 200°C | Very high hardness |
| 300°C | Slight hardness reduction |
| 450°C | Moderate hardness |
| 600°C | Lower hardness, higher toughness |
Example:
Suppose a gear requires:
- Good wear resistance
- Moderate toughness
Selected tempering temperature:
Around 300–450°C
2. Using tempering charts
Engineers frequently use tempering curves.
These graphs relate:
- Tempering temperature
- Hardness
- Time
Example procedure:
Step 1:
Determine steel grade.
Step 2:
Find hardness required.
Step 3:
Read corresponding temperature from chart.
Example
Suppose hardened steel:
Hardness after quenching:
65 HRC
Required final hardness:
50 HRC
Tempering chart may indicate:
Required temperature:
Approximately 450°C
3. Empirical hardness relationship
A simplified engineering relationship sometimes used:
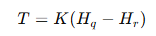
Where:
- T = estimated tempering temperature
- Hq = hardness after quenching
- Hr = required hardness after tempering
- K = material constant
This is only an approximation.
Actual values depend on:
- Alloy composition
- Steel grade
- Heat treatment history
Factors affecting tempering temperature selection
Material composition
Different steels behave differently.
Examples:
Low-carbon steel:
Requires different conditions than alloy steel.
Alloy elements affecting tempering:
- Chromium
- Nickel
- Molybdenum
- Vanadium
- Manganese
Required mechanical properties
Questions considered:
Do we need:
- High wear resistance?
- High toughness?
- High impact resistance?
Different applications require different temperatures.
Component application
Examples:
Cutting tool
Needs:
- High hardness
Lower tempering temperature:
150–250°C
Spring
Needs:
- Elasticity
- Toughness
Higher temperature:
350–500°C
Gear
Needs:
- Wear resistance
- Tough core
Moderate temperature:
300–450°C
Time of tempering
Temperature alone is not enough.
Holding time also affects properties.
General rule:
Higher time + higher temperature
→ greater softening
Tempering color method (traditional approach)
Historically, craftsmen estimated temperature using oxide colors formed on steel.
| Color | Approximate temperature |
|---|---|
| Pale yellow | 220°C |
| Dark yellow | 240°C |
| Brown | 260°C |
| Purple | 280°C |
| Blue | 300–320°C |
This method is less accurate than modern digital systems.
Example calculation
Suppose:
Steel shaft hardness after quenching:
60 HRC
Required hardness:
50 HRC
Using material tempering data:
Corresponding temperature:
≈ 450°C
Procedure:
- Heat shaft to 450°C
- Hold for required time
- Air cool
Final hardness approaches desired value.
Modern methods
Industries now use:
- Computer heat-treatment software
- Tempering databases
- Digital control systems
- AI-assisted process optimization
These improve consistency.
Summary:
Tempering temperature must always remain below the lower critical temperature (Ac1). Heating above this may begin phase transformations and alter the heat-treatment result.
Conclusion
Tempering temperature is usually selected rather than directly calculated. It is determined from hardness requirements, steel composition, tempering charts, and application needs. Lower temperatures preserve hardness, while higher temperatures improve toughness and ductility. Proper selection ensures the desired balance of mechanical properties.
Other courses: